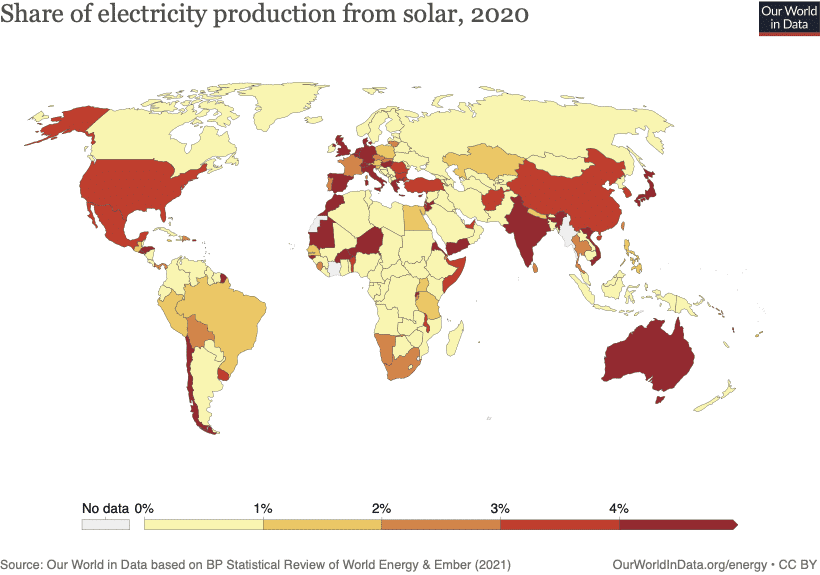
In 2012 solar power produced just 0.5% of global electricity. It’s only a speck compared to coal (42%), natural gas (21%), hydro (15%) and nuclear (12%).
But solar is a startup. And market share is the wrong way to judge a startup. The fact that the iPhone had no market share in 2007 is cold comfort to Nokia shareholders today.
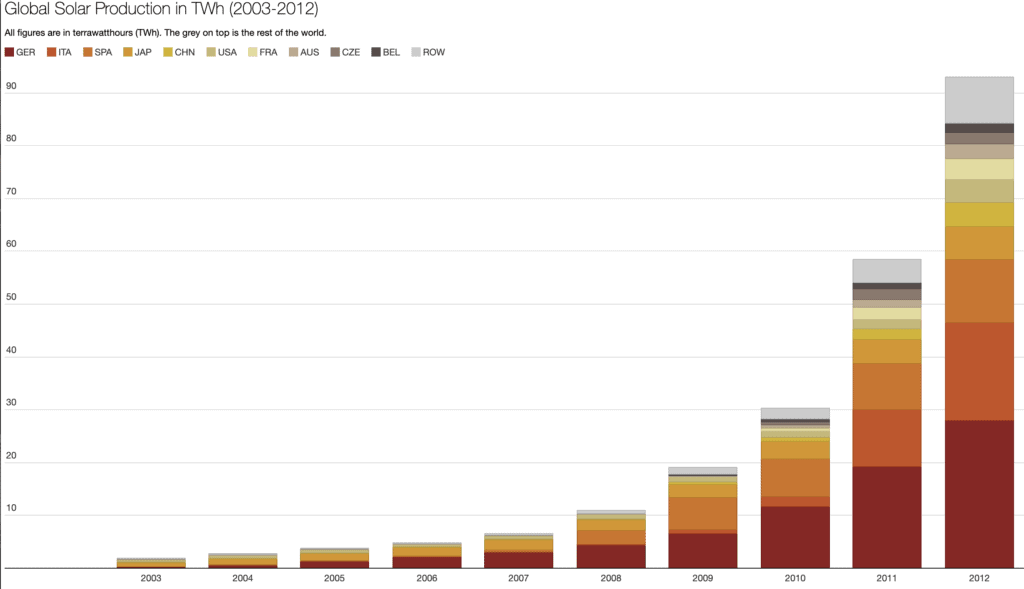
Now I’m not sure as to how big solar is going to be, but the last five years have made me a lot more optimistic than I used to be.
That is the type of growth you’d like to see in a promising startup. It is still early days, but solar could really make a dent.
Stacked column charts aren’t the easiest on the eye for comparing the countries. So I’ve broken out the country level data below.
This next chart looks a little empty to begin with (in 2003), but click slider at the top to see who has been winning the solar race each year over the last decade. Don’t ruin it by jumping straight to 2012, it is much more fun if you go year by year and watch it start to kick off.
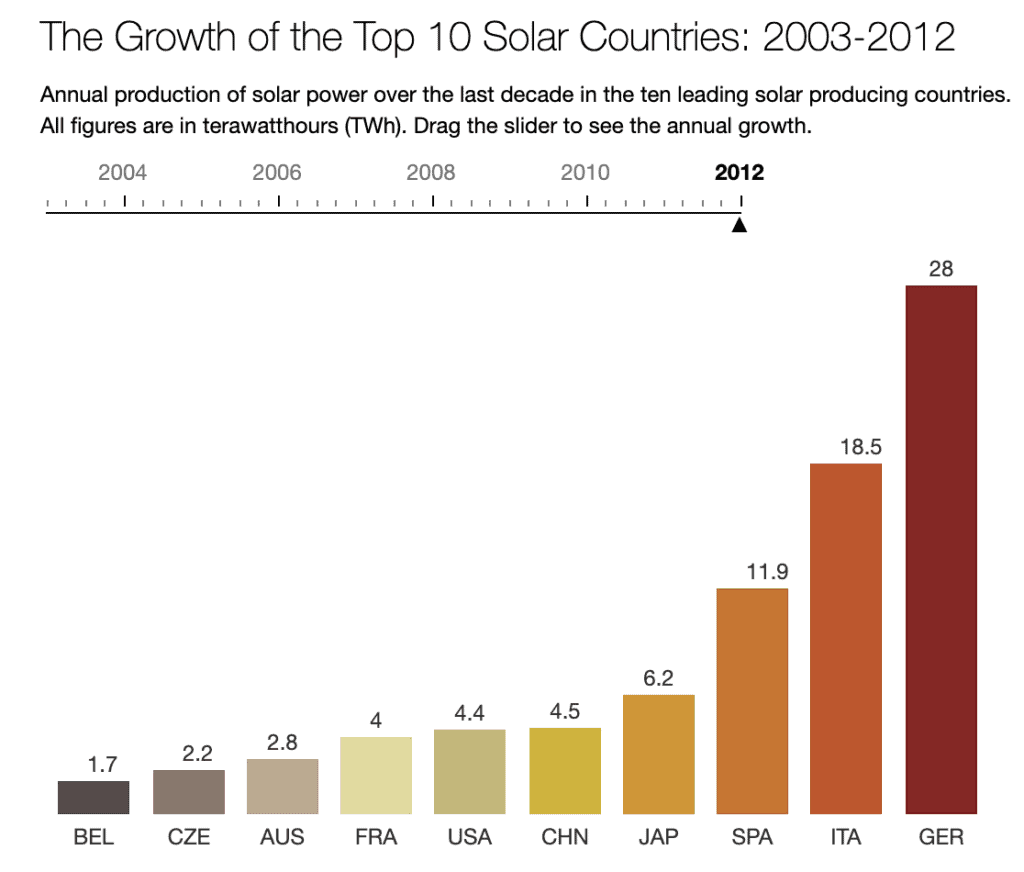
Here comes the sun!
Lindsay Wilson
I founded Shrink That Footprint in November 2012, after a long period of research. For many years I have calculated, studied and worked with carbon footprints, and Shrink That Footprint is that interest come to life.
I have an Economics degree from UCL, have previously worked as an energy efficiency analyst at BNEF and continue to work as a strategy consultant at Maneas. I have consulted to numerous clients in energy and finance, as well as the World Economic Forum.
When I’m not crunching carbon footprints you’ll often find me helping my two year old son tend to the tomatoes, salad and peppers growing in our upcycled greenhouse.